flynn.gg
Christopher Flynn
Machine Learning
Systems Architect,
PhD Mathematician
Projects
Open Source
Blog
Résumé
GitHub
Blog
Proportional Downloads on pypistats.org
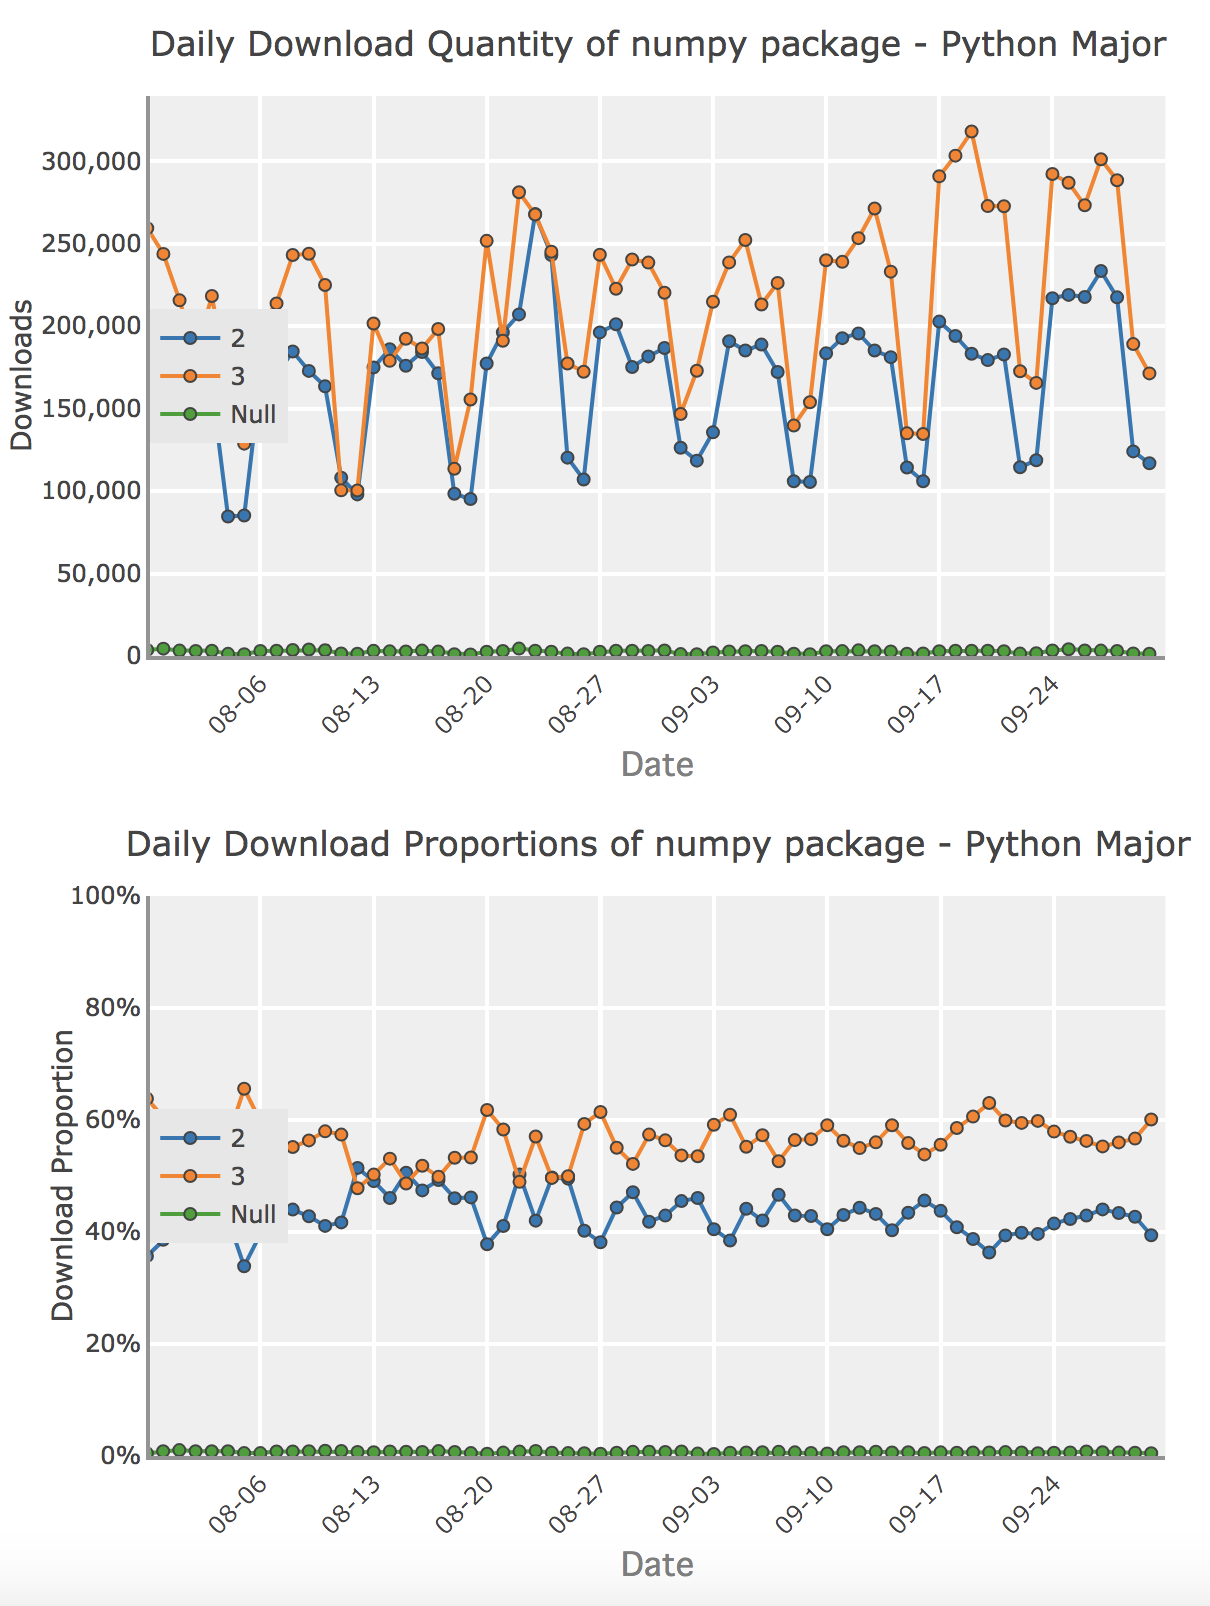
Since the launch of pypistats.org, I’ve gotten some feedback about some aspects of the website. One bit of criticism was that a major interest for open source maintainers was how downloads were proportioned across segmentations such as python version and operating system. These proportions can be inferred this from the original charts which showed absolute download counts, but having the data proportioned visually makes the comparisons a lot easier.
This past weekend I updated the packages page to show a chart of downloads proportioned after the absolute downloads chart for each segmentation. Here is a sample using numpy and major version number of Python.

See the project on GitHub and explore the live site.
Further reading
pypistats.org

