flynn.gg
Christopher Flynn
Machine Learning
Systems Architect,
PhD Mathematician
Projects
Open Source
Blog
Résumé
GitHub
Blog
Shap support for skranger/skgrf

The latest releases of both skranger and skgrf are now compatible with the shap library for explaining predictions of machine learning models.
shap is a python package that produces Shapley values for machine learning predictions, which are used to explain the relationships between the predictions and the features used to generate them. It can help modelers understand why a machine learning model makes the predictions it does.
shap works with forest estimators by consuming the underlying structure of each decision tree. For scikit-learn forests this means extracting the decision tree structure from the ensemble of trees in the model. In order to make skranger and skgrf compatible, we just needed to re-implement the tree structure interface. Some of this structure is exported from the ranger and grf C++ libraries, but the rest needed to be additionally implemented.
To use shap with skranger, for example, a small context manager is provided which patches objects so that shap thinks they are sklearn models. Since the tree interface is implemented in the same way, shap is able to parse the tree structures and build an explainer.
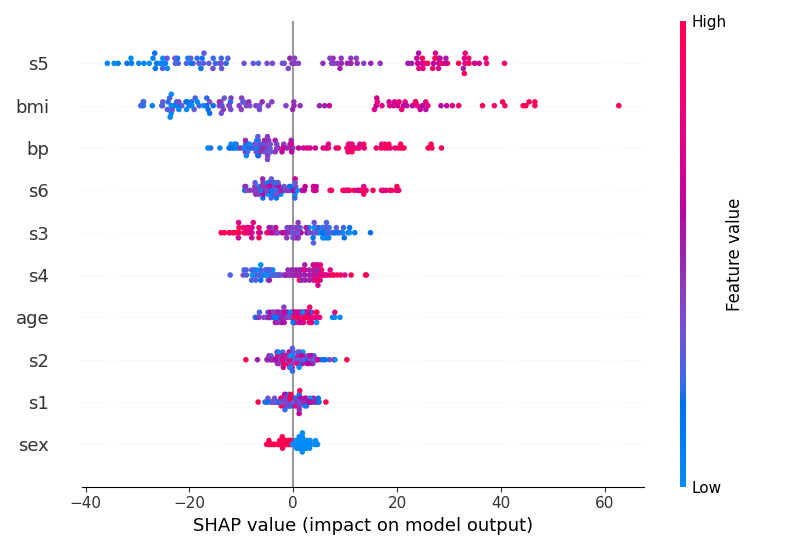
Here is a simple regression example using the patch to generate a beeswarm plot with skranger (skgrf also has this patch available). The patch only needs to be applied when creating the explainer:
import shap
import matplotlib.pyplot as plt
from sklearn.datasets import load_diabetes
from sklearn.model_selection import train_test_split
from skranger.ensemble import RangerForestRegressor
from skranger.utils.shap import shap_patch

X, y = load_diabetes(return_X_y=True, as_frame=True)
X_train, X_test, y_train, y_test = train_test_split(X, y)

# must enable tree details here
clf = RangerForestRegressor(enable_tree_details=True).fit(X, y)

with shap_patch():
    explainer = shap.TreeExplainer(clf)

shap_values = explainer(X_test)

shap.plots.beeswarm(shap_values, show=False)
plt.tight_layout()
plt.savefig("beeswarm.png")

Further reading
skranger
skgrf
shap

